
1. Demographic module
1.1. Overview
The demographic module is designed to create synthetic life histories (i.e. from birth to death) which when aggregated reproduce population dynamics for a given country (for years 1990-2050).
The aim of the demographic module is to initialize the demographic characteristics of every individual:
birth date
gender
migration status (native or immigrant).
1.2. Data inputs
Demographic data - populations, births, death rates, life expectancies- are provided by the:
Human Mortality Database (HMD): historical data for 37 countries [Human Mortality Database [80]].
United Nations - World Population Prospects (UN-WPP): historical data (for every country not coverered by HMD) and projections for every modelled country, [United Nations [89]].
No data on migration flows have been used. Net migration is calculated ex-post as the difference between the number of people in each age/gender sub-category from population estimates and the projected number of people with previous population and deaths (see Section 1.2.3). This allows the model to more accurately replicate population dynamics.
1.2.1. Births
Replication of population dynamics is based on the distribution of past and future births (gender specific) for natives and migrants. This is based on the principle that in order to have X people aged N at a certain point of time, X + Y have to be born N years before, with Y representing the people who die before age N.
The model reproduces population dynamics from 1990 to 2050. The 1990 population is used as the entry point of the demographic module. As the maximum age in the model is 110, births can occur from 1880 (1990 - 110) to 2050. From 1880 to 2050 birth estimates are computed using:
From 1990 to 2015: historical births estimates from HMD or UN-WPP.
From 2016 to 2016: births projection estimates published by [United Nations [89]].
Before 1990: births per year are artificially reconstructed using the 1990 population estimates and historical death rate (HMD or UN-WPP) as explained if Fig. 1.1.

Fig. 1.1 Reconstruction of births from 1991 population estimates
Birth estimates are then used to compute the cumulative distribution of births (used to initialize individuals) and the case-weight of every simulated individual. A simulation with 1 million cases is a simulation with 1 million births (natives and migrants)
For migrants, the process is very similar with the addition of year of migration. For every year between 1991 and 2050, starting from the net migration flows by age/gender, births are reconstructed (using the same process described in Fig. 1.1).
The proportion of migrants, i.e. the proportion of migrant births on total birth, is extracted by comparing total numbers of births for natives en migrants.
1.2.2. Death rates
Historical mortality rates are derived from [Human Mortality Database [80]] where data are available and from [United Nations [89]] otherwise. When diseases are included in the model, cause-specific mortalities are removed from total mortality to compute residual mortality (see Section 2.1.2.1).
1.2.2.1. Projections
Life expectancy projections, provided by [United Nations [89]], are used to project mortality rates until 2050. The principle is to apply a scaling factor (multiplicatively) to the last available mortality rates to match the expected level of life expectancy. Life expectancy projections are interpolated to provide yearly estimates and thus yearly estimates for the scaling factor. Fig. 1.2 illustrates the projection using data for Japan. The mortality rates are displayed in log form, therefore the scaling factor is additive, and curves are a translation of the latest available data, in this case, 2016.
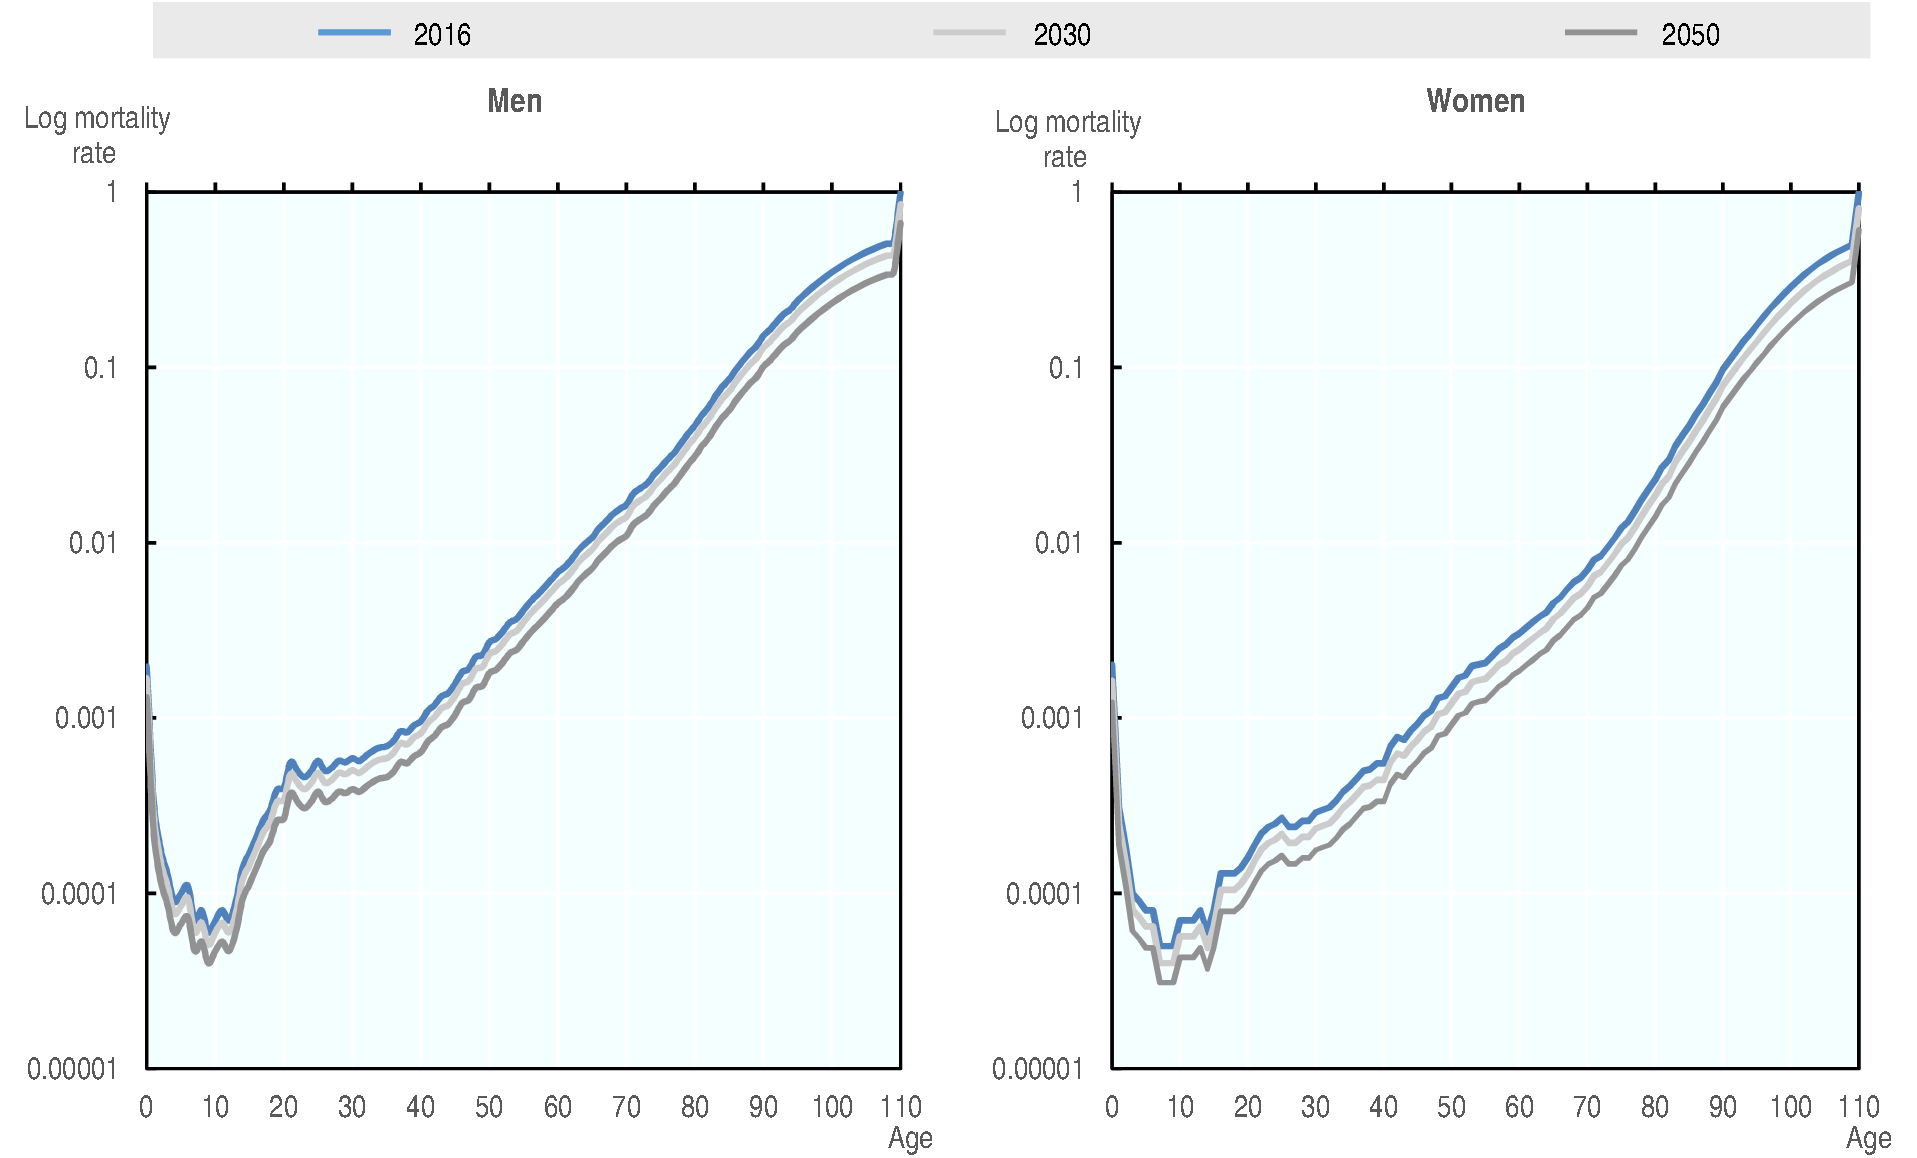
Fig. 1.2 Projection of historical mortality rates until 2050 for Japan
1.2.3. Migration
Net migration represents the number of incoming migrants less the number of outward migrants. As previously explained, historical net migrations have been reconstructed from population estimates, capturing the difference of populations unexplained by deaths: for year \(y\) and age \(n\), net migration flows is:
During the projection period, the age-gender pattern of the last ‘historically reconstructed’ migration flow is combined with projections of migration rates provided by UN-WPP to project immigration flows.
Positive migration flows impact the initialization of individuals (Section 1.2.1) whereas negative flows are converted into hazard rate (year/age/gender specific) of leaving the country. Those are used by the emigration event and then impact the simulation of an individual (and not its initialization).
1.3. Simulation
All individuals are simulated from their birth to their exit event (by death or outward migration). The following characteristics are first initialized:
Migrant satuts (native or immigrant): random with the proportion of migrants.
Birth year and gender (and year of arrival if migrant) are randomly chosen using the distribution of births previously described.
Birth Date (same for date of arrival) is then randomly chosen within the year to respect the continuous time.
Simulation begins with the schedule of the following events:
Change of year
Next birthday
Residual death event (time to event depends on mortality rates).
Immigration event (if migrant) whose timing is defined by the date of arrival
Emigration event (time to event depends on emigration hasard rate). For migrants, time to this event is set to infinit until they arrive in the country.
Those characteristics and events represents the minimal model which is able to reproduce a country specific demography.
Migrants are modelled and simulated exactly the same as full citizen even before they enter in the country. In other words they have the exact same likehood of experiencing the different modelled events as natives. Every simulated individual, native or migrant, who have entered the country, have the same probability of experiencing the emigration event (i.e. leaving the country). Once individuals leave the country, they exit the simulation, thus their course of life no longer affects population outcomes (they cannot re-immigrate).