
5.2. Description of longitudinal datasets
5.2.1. Survey of Health, Ageing and Retirement in Europe
5.2.1.1. Data sources
The main data source for the employment and absenteeism module was SHARE - Survey of Health, Ageing and Retirement in Europe - Release 6.0 of Harmonized SHARE was used for the main analysis, as well as the additional employment module.
SHARE is a multidisciplinary and cross-national panel database of micro-data on health, socio-economic status and social and family networks of more than 120,000 individuals aged 50 or older (more than 297,000 interviews). SHARE covers 21 European countries across Waves 1 – 6. Countries with at least two data points between Waves 1 to 6 (except Wave 3, which is a retrospective dataset) constituted the main dataset for this analysis, covering years 2004-06, 2006/07, 2010/11/12, 2013, and 2015, respectively. Panel data between two consecutive waves constituted the data for the analysis.
Hungary and Croatia only participated in one wave, thus were excluded from the analysis;
Greece did not participate in Wave 4 and 5, and is thus only included in a subset of analyses;
The Netherlands did not participate in Wave 6, and is thus only represented in a subset of analyses;
Poland did not participate in Wave 5, and thus is not included in the final results.
The age restriction for inclusion in the longitudinal analysis was 50 – 63 years. This reflects the fact that in the subsequent wave, exiting employment was most likely due to age-related retirement, rather than health status. Table 5.2 shows several characteristics of the study population, with sample size ranging from 27,395 to 10,490, employment rates between 55.1 to 65.8 percent, and the majority of participants are women. The average population is overweight, and the proportion of respondents with at least one NCD rises with the year of the survey, as does the percentage of respondents with at last two NCDs (data not weighted).
A two-time-period panel analysis (rather than a multi-time point panel analysis) was performed, driven by the specific age range of the study population, as well as the >50% attrition over three or more survey waves. While missingness patterns between waves 1 and 2, and waves 5 and 6 were found to be random for all outcomes variables in question, loss-to-follow-up between waves 4 and 5 was non-random in the overall analysis. Thus, wherever possible, waves 5 and 6 were used for the analysis, except for the alcohol module and Dutch data, where waves 4 and 5 were used, adjusted for attrition. For the impact of alcohol use on labour market outcomes, analysis was performed on waves 4 and 5, since wave 5 and 6 had different alcohol variables which were incompatible for comparison with previous waves (Table 5.2).
Eligible population |
Mean age |
Employement rate |
Women |
1 NCD prevalence |
2 NCDs prevalence |
Obese |
Heavy drinkers |
Tertiary education |
Physically active |
Home owners |
In partnership |
|
|---|---|---|---|---|---|---|---|---|---|---|---|---|
Absenteeism Analysis: |
||||||||||||
Wave 1 (baseline) |
14 905 |
56.4 |
55% |
54% |
38% |
9% |
19% |
NA |
24% |
69% |
76% |
NA |
Wave 2 (follow-up ) |
10 490 |
58.9 |
55% |
55% |
48% |
15% |
21% |
9% |
24% |
68% |
79% |
82% |
All alcohol-related analyses: |
||||||||||||
Wave 4 (baseline) |
23 628 |
57 |
59% |
56% |
45% |
14% |
25% |
9% |
24% |
66% |
77% |
83% |
Wave 5 (follow-up) |
17 107 |
59.1 |
58% |
57% |
53% |
19% |
24% |
9% |
25% |
67% |
78% |
80% |
Employment Likelihood & Hours worked analysis: |
||||||||||||
Wave 5 (Baseline) |
27 395 |
57.3 |
66% |
56% |
47% |
15% |
23% |
NA |
27% |
68% |
78% |
80% |
Wave 6 (follow-up) |
19 688 |
59.4 |
62% |
57% |
54% |
20% |
24% |
NA |
27% |
67% |
78% |
81% |
5.2.1.2. Variables
The employment module of SHARE includes questions on employment status, type of employment (sector/ self-employed or employee/ full-time equivalents), recipient of disability payments, early retirement, and other welfare payments. The employment module (EW module) of SHARE was merged with the larger harmonized SHARE dataset. (Release 6.0).
The main outcome variables were employment status (binary), days of work missed in the last 365 days (continuous), average hours worked per week (if working), and desire to retire early (yes/no) if working.
Exposure variables were the presence/ absence of select chronic conditions and risk factors in the previous wave, including: cancer (yes/no), diabetes (yes/no), weight category (normal/ overweight/obese), hypertension (yes/no), stroke (yes/no), heart disease (yes/no), lung disease and COPD (yes/no), alcohol use (former/never/moderate/high drinker), smoking (yes/no) and level of physical activity (none/low/moderate/high categories). Lagging risk factor and disease variables served to address the temporality issue between exposure and outcomes.
Control variables (potential contemporaneous confounders) were not lagged, and included smoking status, education level (no secondary/secondary/tertiary), age (in five-year/10-yr categories), marital status (married or in partnership/ single; the category ‘single’ included both those who were previously married, widowed, or single), gender, and number of social or religious activities per year (for the alcohol module). Current smoking levels and physical activity levels also served as control variables in select models. In general, risk factors and disease variables that acted as potential confounders were not lagged (i.e. heart disease when impact of alcohol use was investigated). The model also included country level fixed effects.
5.2.1.3. Sampling weights and missingness patterns
Survey weights: Based on the Akaike information criterion (AIC) tests [Bozdogan, 1987 [5]], and robustness checks of effect size estimates [Launer, Wilkinson and United States. Army Research Office. Mathematics Division, 1978 [37]], it was concluded that a specification without calibrated survey weights resulted in more robust and concise effect sizes as well as improved the goodness of fit of all models.
Exploration of missingness patterns: Missingness patterns were explored for each consecutive wave. Based on both comparative baseline and stepwise regression analysis, attrition between waves 5 to 6 was judged to be random for the outcome variables in question. Thus, for the analysis of employment status and absenteeism for these two waves, no further adjustment was required, allowing for a wider selection of models. All analyses were conducted in STATA 15.
5.2.2. English Longitudinal Study on Ageing
The English Longitudinal Study on Ageing (ELSA) is a longitudinal household survey dataset for the study of health, economic position, and quality of life among the elderly. Sample members are drawn from respondents to the Health Survey for England (HSE). Study members have a face-to-face interview (a computer-assisted personal interview followed by a self-completion questionnaire) every two years of the study and a nurse assessment every four years (e.g. wave 2, 4, 6 and 8). The first wave was conducted between March 2002 and March 2003. The 8th and most recent wave was conducted during 2017 and is currently being processed for release. The herein presented analysis uses data from waves 2, 3,4,5,6, and 7.
ELSA was designed after the Health and Retirement Study (HRS), a similar longitudinal survey dataset in the United States. In order to enable researchers with remarkable opportunities to conduct cross-countries studies, a harmonised version of each survey was released. Regarding the data corresponding to the domain of chronic medical conditions, both SHARE and ELSA provide similar modules to study diagnosis and treatment. As in the previous section, a longitudinal model utilising the ELSA was used to assess the impact of diseases directly attributable to these BMI on the likelihood of employment, hours of work per week, and early retirement. Early retirement was defined as retirement prior to age 60.
ELSA does not contain a variable which allows us to quantify if individuals have missed days of work due to illness, therefore it is not possible to directly estimate the effects of risk factors and NCDs on presenteeism and absenteeism.
With the aim of improving analytical power, a pooled cross-sectional analysis (rather than a multi-time point panel analysis) was performed by combining data on employment status from wave 3, 5 and 7. For instance, out of 1,844 individuals, only 8 suffered a stroke between wave 2 and 3, and 24 were diagnosed with cancer and 32 with diabetes. As illustrated in Fig. 5.2, the main lagged health exposures (e.g. BMI, chronic diseases, physical activity and drinking) were obtained from waves 2, 4 and 6.
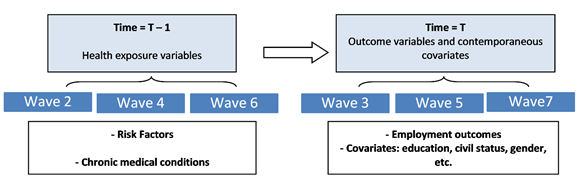
Fig. 5.2 Schematic of longitudinal aspect of ELSA analysis
The following table shows the number of observations from each wave available for the employment likelihood and early retirement modules.
Wave |
Employment likelihood |
Early retirement |
|---|---|---|
3 |
2,245 |
1,717 |
5 |
2,279 |
1,502 |
7 |
1,494 |
1073 |
Total |
6,218 |
4,292 |
The age restriction for inclusion in the pooled analysis was 40-62 years old in the wave that constituted the disease exposure. Table 5.4 highlights the main characteristics of the ELSA study population. The average individual in the sample is either overweight or obese: around one third of the individuals have a BMI higher than 25. Approximately 1 out of 3 respondents have at least one NCD and less than 15 percent have two or more.
Eligible population |
Mean age |
Employement rate |
Women |
1 NCD prevalence |
2 NCDs prevalence |
Obese |
Heavy drinkers |
Tertiary education |
Physically active |
In partnership |
|
|---|---|---|---|---|---|---|---|---|---|---|---|
Employment likelihood module |
|||||||||||
Baseline |
7 902 |
56.3 |
77% |
55% |
31% |
12% |
33% |
36% |
23% |
24% |
81% |
Follow-up |
6 218 |
58.1 |
78% |
56% |
34% |
15% |
32% |
36% |
25% |
24% |
82% |
Early retirement module |
|||||||||||
Baseline |
5 584 |
54.1 |
79% |
57% |
29% |
10% |
33% |
36% |
22% |
25% |
81% |
Follow-up |
4 292 |
56.7 |
82% |
57% |
33% |
11% |
33% |
41% |
19% |
28% |
84% |
Attrition is defined as loss of follow up between two consecutives waves. The employment likelihood had a 21% rate of attrition, while for early retirement this figure rose to 23%.
Wave 2 |
Wave 4 |
Wave 6 |
Total |
% of attrition |
|
|---|---|---|---|---|---|
Employment likelihood |
579 |
553 |
552 |
1,684 |
21 |
Early retirement |
440 |
436 |
416 |
1,292 |
23 |
Missingness patterns were explored for each consecutive wave. Patterns due to attrition were identified to not be at random. Thus each module attrition was adjusted for via stabilized IPW (Inverse Probability Weights).
5.2.2.1. Variables
The ELSA analysis is performed by using the same set of health exposure variables (presence/ absence of select chronic conditions and risk factors) as in the previous section which analysed SHARE. However, ELSA design allows us to differentiate between the duration a given individual has been diagnosed with a NCD by providing information on whether individuals ever were diagnosed or, on the other hand, if they were diagnosed since the last wave. To provide robustness tests, this section uses both set of variables. Physical activity is classified in three categories: hardly active, one to three times per week, and more than three times per week. As in the previous section, the health exposure variables and risk factors are lagged. Control variables (potential contemporaneous confounders) were not lagged and included smoking status, education level (no secondary/secondary/tertiary), age, marital status (married or in partnership/ single; the category ‘single’ included both those who were previously married, widowed, or single), and gender.
5.2.3. Japan Study of Aging and Retirement
The Japan Study of Aging and Retirement (JSTAR) database is a microdata panel database including information on the economic, social, and health conditions of Japanese individuals aged 50 or older, conducted by the Research Institute of Economy, Trade and Industry (RIETI) of Japan, Hitotsubashi University and the University of Tokyo. The JSTAR has 4 waves and covers 3 city groups which encompass 10 municipalities as total, over the years from 2007 to 2013 (Table 5.6).
Group 1: (5 municipalities) |
Group 2: (2 municipalities) |
Group 3: (3 municipalities) |
|
|---|---|---|---|
Wave 1 (2007) |
Baseline |
||
Wave 2 (2009) |
Follow-up |
Baseline |
|
Wave 3 (2011) |
Follow-up |
Follow-up |
Baseline |
Wave 4 (2013) |
Follow-up |
Follow-up |
Follow-up |
Two consecutive data waves were merged into one pooled panel dataset with two data poins (t-1 and t) for analysis purposes. The age restriction for inclusion in the longitudinal analysis was 50 to 63 years at baseline (t-1). The average effective retirement age among Japanese working population was 69.5 years old for men and 66.5 years old for women in 2007 [OECD, 2018 [44]]. Respondents who already retired at baseline and had no intention to work were also excluded from the analysis. In the absenteeism analysis, respondents who answered that they were not allowed to take sick leave were excluded. Among the working population, 19.6% of respondents answered that they were not entitled to take sick leave (47.0% of respondents did not answer to this question).
5.2.4. Mexican Health and Aging Study
The Mexican Health and Aging Study (MHAS) is a national longitudinal study covering adults aged 50 years and over in Mexico [University of Texas Medical Branch et al. [90]].
The baseline survey was conducted in 2001, which included national and urban/rural adults born in 1951 or earlier. Follow-up interviews were undertaken in 2003, 2012, 2015 and 2018. For the 2012 survey, a new sample of adults were introduced which covered those born between 1952-1962. Similarly, in 2018, a new cohort of adults born between 1963-1968 were added [University of Texas Medical Branch et al. [90]].
The study is a collaborative effort among researchers from the University of Texas Medical Branch (UTMB), the Instituto Nacional de Estadística y Geografía (INEGI, Mexico), the University of Wisconsin, the Instituto Nacional de Geriatría (INGER, Mexico), the Instituto Nacional de Salud Pública (INSP, Mexico), and University of California Los Angeles (UCLA). The MHAS is partly supported by the National Institutes of Health/National Institute on Aging (R01AG018016, R Wong, PI) and the INEGI in Mexico [University of Texas Medical Branch et al. [90]].