
4.8. Modelling the cost of injury
The costs of back pain and injuries could not be estimated based on available administrative microdata.
In order to address this data gap, for injury specific costs, a combinatorial approach between a PAF-, microsimulation-, and bottom-up approach was applied.
Injuries associated with the highest burden of disease due to alcohol use are road injuries, unintentional injuries, self-harm, and interpersonal violence. Road injuries, transport injuries (including falls and drowning), and self-harm contribute to the largest proportion of the alcohol-attributable disease injury burden, and, together with the other listed conditions, the largest proportion of alcohol-attributable disease burden. The cost related to injuries affected by inter-personal violence was estimated as well, due to readily available data.
Several countries report on injury costs as part of their reporting on health spending, for the annual Systems of Health Accounts/ National Health Accounts reporting to the OECD. In particular, Hungary, Sweden, Greece, and Estonia, have positively responded to our inquiry and provided injury health spending data per five-year age group (Table 4.7).
Country |
Data level and coding |
Type of care |
Year data available |
|---|---|---|---|
Estonia |
ICD-10 coding, by age and sex |
All providers, no drug costs |
2015 |
Sweden |
ISHMT coding, by age and sex |
Inpatient Injury treatment costs |
2016 |
Greece |
Average injury costs, by age and sex |
All providers |
2013 |
Hungary |
Average injury costs, by age and sex |
2014 |
Note: This table highlights the retrieved data from country statistics offices, reflecting the cost of injury by age and sex, broken down into more detailed injury types and providers, where data are available.
The injury cost data provided to the OECD was either an average cost per case, age group, and sex (i.e. Greece), or a cost per treatment, age, sex, and ICD-Code (Estonia), or based on ISHMT injury groups. The ‘per case’ cost refers to the sum of costs incurred by the same individual under the same diagnosis over the span of one year. For example, if someone incurred an ankle injury and sought multiple physiotherapy treatment sessions, the ‘per case’ cost for the ankle injury reflects the sum of these multiple visits. ‘Per treatment’ cost would only reflect the cost for one single session.
As shown in Table 4.8, the IHME injury groups associated with alcohol use are road injuries, transport injuries, and self-harm. Both ISHMT-codes as well as ICD-10 codes can be related through a set of matrices and weights to these IHME groups.
Road Injury, Transport Injuries |
Self-Harm |
Interpersonal Violence |
||||
|---|---|---|---|---|---|---|
men |
women |
men |
women |
men |
women |
|
0-4 |
4837 |
4816 |
4008 |
3815 |
3772 |
3536 |
05-Sep |
5686 |
4417 |
5864 |
4019 |
5328 |
3746 |
Oct-14 |
5140 |
4586 |
4554 |
4083 |
4282 |
3774 |
15-19 |
6395 |
5179 |
4937 |
3656 |
5118 |
3476 |
20-24 |
7373 |
6552 |
5670 |
4660 |
6274 |
4924 |
25-29 |
7201 |
6366 |
4894 |
4539 |
5536 |
5288 |
30-34 |
8201 |
5890 |
6134 |
4650 |
7500 |
4817 |
35-39 |
6707 |
5420 |
4848 |
3833 |
5376 |
3952 |
40-44 |
7074 |
6541 |
5336 |
4834 |
6382 |
5459 |
45-49 |
7420 |
6786 |
5796 |
5341 |
6766 |
5751 |
50-54 |
7372 |
6739 |
5398 |
5090 |
6496 |
5601 |
55-59 |
8048 |
6334 |
6670 |
5244 |
7297 |
5589 |
60-64 |
7707 |
5905 |
6088 |
4827 |
7051 |
5063 |
65-69 |
7175 |
6686 |
5696 |
5494 |
6396 |
5926 |
70-74 |
7306 |
6593 |
6048 |
5483 |
6301 |
5697 |
75-79 |
7068 |
6650 |
5827 |
5998 |
6080 |
5928 |
80-84 |
7166 |
6602 |
5949 |
5530 |
6054 |
5506 |
85-89 |
6670 |
6432 |
5397 |
5327 |
5455 |
5287 |
90-94 |
6394 |
6372 |
5214 |
5258 |
5190 |
5215 |
>=95 |
5722 |
6442 |
4112 |
5719 |
4231 |
5583 |
Source: Source: Swedish Ministry of Health Statistics office; data converted to EURO based on OECD statistics and economic data, as well as classified by GBD injury cause groups
Table 4.8 includes information on the relationship between ISHMT codes and IHME injury sequelae; ADDREF depicts the relationship between ICD-10 codes, IHME sequelae, and IHME code names [Vos et al., 2012 [61]]. Information in Table 4.8 was applied to injury data to obtain the per case, age-group, and sex specific injury costs that are then applied to the injury cases in the absence/presence of alcohol use/ under various alcohol policy scenarios.
In addition, since not all countries have cost data for injuries, the extrapolation methods described under Cost extrapolation to other countries were used. In addition, the extrapolation component calibrated the costs based on inpatient, outpatient and pharmaceutical expenditure ratios, and rescale the costs to reflect total population coverage.
Fig. 4.2 and Table 4.8 show the per injury case costs obtained from Greece and Sweden, respectively These data were combined with injury case outputs under various drinking and policy scenarios, obtained from the microsimulation model. With regard to the injury cost data provided by Greece, the data did not differentiate the costs by injuries. Therefore, there is a single age/gender specific cost that was uniformly applied to each alcohol-related injury type. In contrast, the Swedish and Estonian data allowed for differentiation of costs by age, sex, and GBD cause-group level.
Under the third step, the epidemiological output was combined with the per-case health care costs for alcohol related conditions.
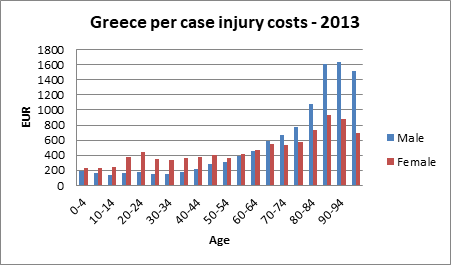
Fig. 4.2 Injury cost per age, sex, and per case in Greece, 2013
Source: OECD 2017/18 analysis on Greek injury cost data