3.2.4. Physical activity
3.2.4.1. Modelling principles for physical activity
Data on country-specific level of physical activity were obtained from [Institute for Health Metrics and Evaluation (IHME) [82]]. Physical activity per week is measured by MET (metabolic equivalent of task) minutes per week, which covers physical activity at work, home, getting to and from transport, and recreational activities.
The dataset categorises physical activity into four groups and is available by gender- and age-group, and is provided every five years over the period 1990-2015:
Inactive (below 600 METs)
Low level of activity (between 600METs/week and 4000 METs/week)
Moderately active (between 4000 METs and 8000 METs/week)
Highly active (more than 8000 METs/week).
(Note: 600 METs/week corresponds to WHO guidelines for physical activity of 150 minutes of moderate activity or 75 minutes of intense activity).
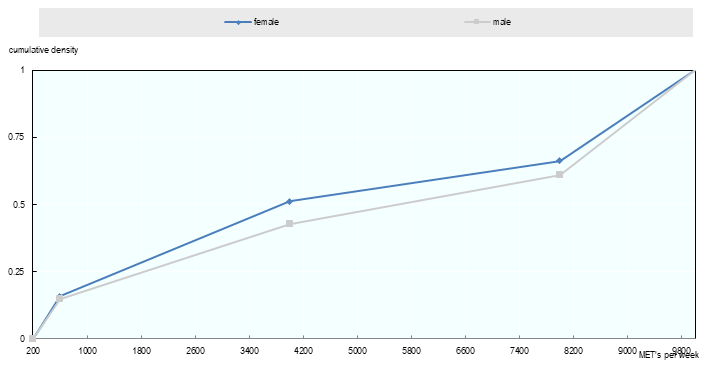
Physical activity is modelled as a continuous variable. A piecewise linear function is assumed to model the cumulative distribution function. This is calibrated in order to match the prevalence of the four available physical activity categories (inactive – highly active). The lower bound of 200 METs/week and upper bound of 10,000 METs/week are applied in order to retain plausibility.

Fig. 3.9 Physical activity, cumulative density (Czech Republic, 2015, ages 50-55)
3.2.4.2. Relative risks and baseline risks
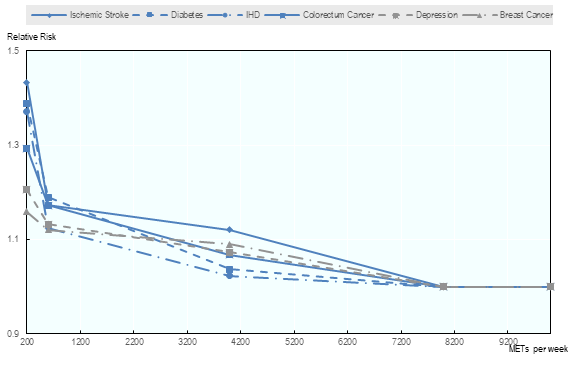
Relative risks by category of physical activity are interpolated with a piecewise linear function. Relative risks are taken from the following source, [GBD 2016 Risk Factors Collaborators et al., 2017 [73]].
For each disease, the baseline risk is computed as following, with \(f_{PA}(pa)\) the density function deduced from previously:

Fig. 3.10 Relative risk for level of physical activity (Women and men aged 50-55)
