
3.2.2. Blood Pressure
Data for blood pressure is obtained from NCD RISC [NCD Risk Factor Collaboration (NCD RisC) et al., 2017 [84]] and represents years 1975-2014. Most countries across the world are covered in the dataset, which provides information on mean systolic and diastolic blood pressure, as well as the proportion of people with a systolic blood pressure (SBP) > 140 by age group (18-19, 20-24, …, 80-84, 85+) and gender.
3.2.2.1. Modelling principles for systolic blood pressure
Systolic blood pressue (SBP) is modelled with a log-normal distribution:
The parameters of the log-normal distribution are fitted using the average systolic blood pressure, \(\overline{SBP}\) and proportion of people with high blood pressure, \(\mathbb{P}_{BP>140}\). For each year, \(y\), the following equation system is solved:
Where, \(n_0\) is the first available age (here 18) and \(σ_0\) is computed to match the data \(\overline{SBP}, \mathbb{P}_{BP>140}\) (for the first available age group (here 18-19).
During the calibration procedure a higher weight was used to fit the percentage of people with a high blood pressure compared to those with an average SBP, in order to model the impact of high blood pressure more accurately. Fig. 3.4 and Fig. 3.5 illustrate the methodology and its outputs for France.
As shown in Fig. 3.5, blood pressure rises as a function of age. For example, the blood pressure of an individual in the 50th percentile increases from 107 at 20 years of age to 134 at 65 years.
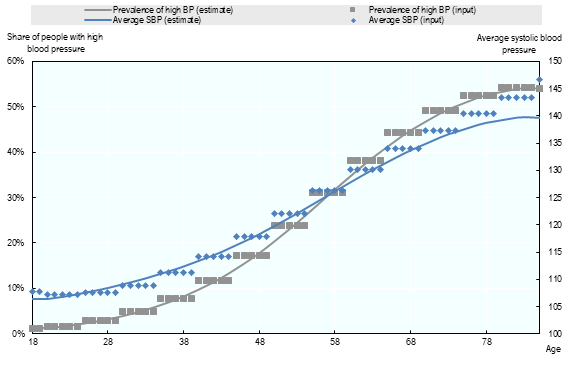
Fig. 3.4 Fitting gamma distribution on average blood pressure and share of people with raised blood pressure (Women - France - 2015).
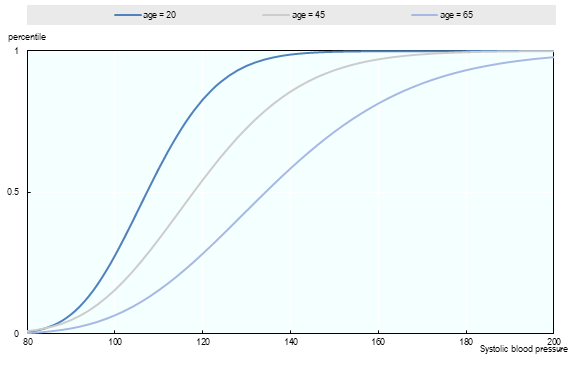
Fig. 3.5 Systolic blood pressure: fitted gamma distribution for different age (Women - France - 2015).
3.2.2.2. Relative risks and baseline risks
The link between SBP and diseases are modelled through relative risks. Relative risk (by age group and by gender) are provided by IHME ([GBD 2016 Risk Factors Collaborators et al., 2017 [73]]) through a linear function (see Fig. 3.6).
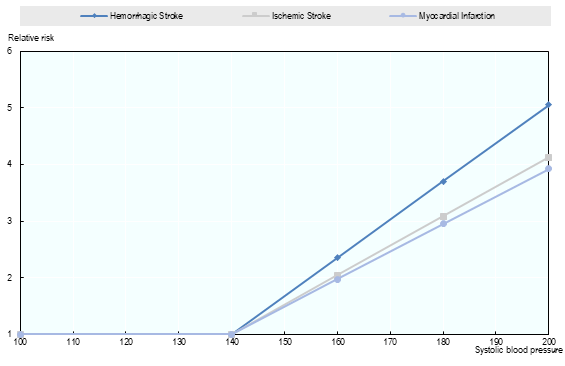
Fig. 3.6 Relative risk for Stroke and Hemorrhagic Stroke based on blood pressure level, men and women aged 50
For each disease, the baseline risk (\(BR\)) is computed as follows:
Where:
\(RR(x)\) = Relative risk based on blood pressure
\(dBP\) = Change in blood pressure (SBP modelled with a log-normal distribution)
\(UR\) = Underlying Risk.