3.2.3. Body mass index
Data on country-specific BMI distributions were obtained from NCD RISC dataset [NCD Risk Factor Collaboration (NCD-RisC) et al., 2017 [85]]. The dataset covers the majority of countries and covers years 1975 to 2014. It provides information on seven BMI categories: below 18.5; 18.5 - <20; 20 - <25; 25 - <30,; 30 - <35; 35-<40; and >=40 , by age and gender.
3.2.3.1. Modelling principles for BMI
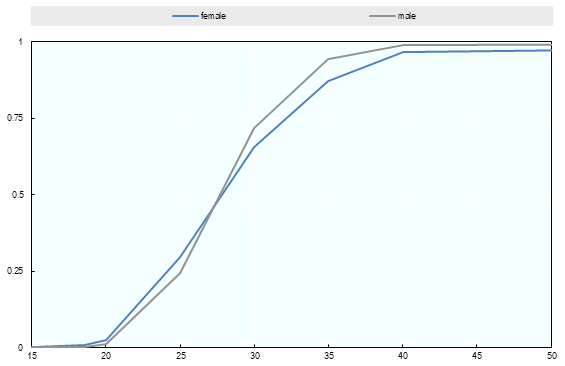
BMI is modelled as a continuous variable with a cumulative distribution function. A piecewise linear function is used for the cumulative distribution and calibrated to match the prevalence of the seven BMI categories available in the NCD RISC dataset. The lower bound of 15 kg/m2 and upper bound of 150kg/m2 are applied to stay within biologic plausibility. Fig. 3.7 illustrates the cumulative distribution function obtained for Latvia in 2014.

Fig. 3.7 BMI, cumulative density, Latvia 2014 (ages 65-70)
3.2.3.2. Relative risks and baseline risk
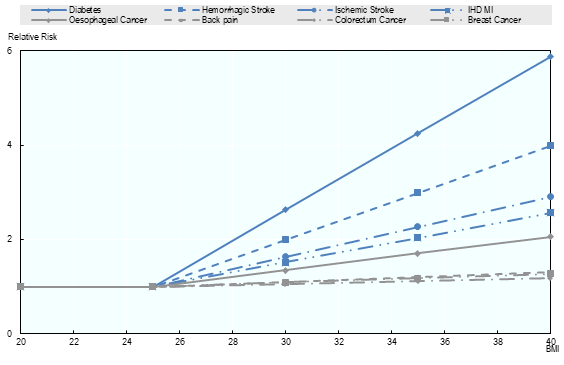
The link between BMI and diseases are modelled through relative risks (RRs). RRs are provided by IHME through a linear function (see technical appendix of [GBD 2016 Risk Factors Collaborators et al., 2017 [73]]). Fig. 3.8 illustrates the RR for BMI, for a woman aged between 50 and 55 years.

Fig. 3.8 Relative risk for BMI, woman aged 50-55
